CC-CEDICT contributions follow Zipf’s law
There’s an egalitarian ethos of the crowd around Open Source. But studies of popular software projects and of Wikipedia show that not all contributors are created equal. Typically, the vast majority of edits comes from a small group of people. An analysis of the change log of CC-CEDICT, the open-source Chinese-English dictionary, confirms this.
Does creativity scale?
Open Source’s touché argument is the wisdom of the crowd, ideally a really large crowd. The argument is as simple as it is captivating: how could the outcome not be superior to the product of small, limited teams if you have hundreds or thousands of passionate volunteers contributing their knowledge? The same reasoning is repeated for software like Linux and knowledge bases like Wikipedia.
Since it is software, and not knowledge bases, that is in the habit of eating the world, it’s natural that software folks were the first to start looking at the way productivity scales with team size. The genre’s classic is Fred Brooks’ 1975 book The Mythical Man-Month,[1] which argued that a software team’s productivity does not grow in tandem with its size. On the contrary, the marginal benefit of adding team members begins to suffer seriously above 10 members because person-to-person connections grow quadratically.
If that is true, how can massive open-source projects possibly outperform carefully managed closed-source efforts? Mocus, Fielding & Herbsleb analyzed the source code and issue history of the Apache web server in 2000[2] and found that a small core of developers was in fact responsible for the vast majority of code changes.
Sornette, Maillart & Ghezzi [3] argued in 2014 that Brooks’ law does not hold true for open-source projects. Unexpectedly, these teams keep growing more productive as they gain more members. The whole, the authors say, is more than the sum of its parts.
Unfortunately that study seems to be isolated. Recently, Scholtes, Mavrodiev & Schweitzer analyzed 580,000 commits from 58 popular projects on Github[4] and showed that adding developers reduces average productivity.
One could argue, however, that knowledge bases are different from software. Changing one Wikipedia article does not invalidate any other articles, while in software a bug in any single line can break the whole application. Perhaps you need a lot more team-wide coordination and planning to make progress with software, and knowledge bases can accommodate input from many more contributors.
That may well be true, but a recent study of Wikipedia[5] still shows that 77% of articles are written by only 1% of editors.
Since I recently launched an open-source dictionary[6] myself, I am extremely curious to understand how community-edited knowledge bases fare over time. Luckily it is possible to browse the change history of CC-CEDICT, the resource that inspired my own project. I decided to adapt the quantitative approaches used to analyze software code and take a close look at CC-CEDICT’s evolution.
10 years of CC-CEDICT history
My event horizon begins in 2007, when MDBG[7] took over CEDICT from its previous maintainer, Erik Peterson. At that time CEDICT had nearly 40k entries, which have since grown to 115k. This is the timespan for which a detailed change log[8] is available.
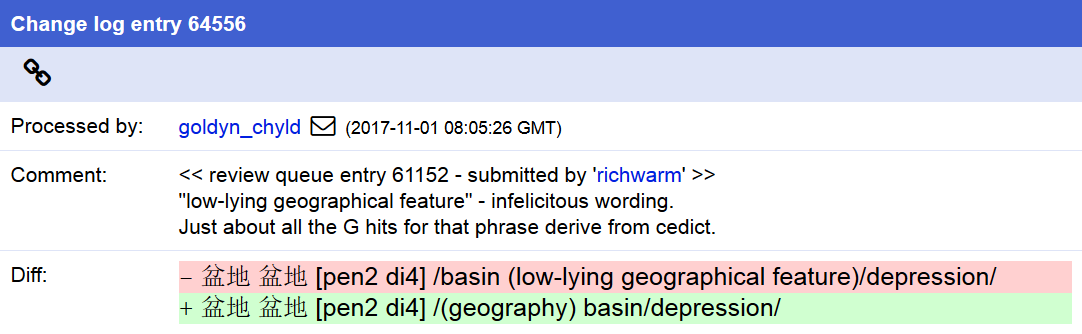
CC-CEDICT’s editorial process relies on a queue of submissions, where changes come in the form of added and deleted lines in the dictionary’s plain text format. Each change needs an editor’s approval to become part of CC-CEDICT; editors may add their own comments and amend or extend the change set itself.
With a slight tweak to the URLs I manually retrieved and saved the entire change history, 5000 changes per page. Once saved locally, it was relatively simple to parse the machine-generated HTML files. I extracted the relevant content and metadata and composed a single plain text file with all the changes.
When a change set affects too many entries, the full list of additions and deletions is only available through the change’s dedicated link. I semi-automatically retrieved and parsed these pages to make sure every single edit is included in my data. There were a bit over 900 such large change sets.
The entire retrieval process finished in a few minutes, but if the MDBG website took a performance hit during that time, I sincerely apologize.
Growth by month
The first chart I created shows the number of additions and deletions each month (blue and red), plus the dictionary’s net growth (green).
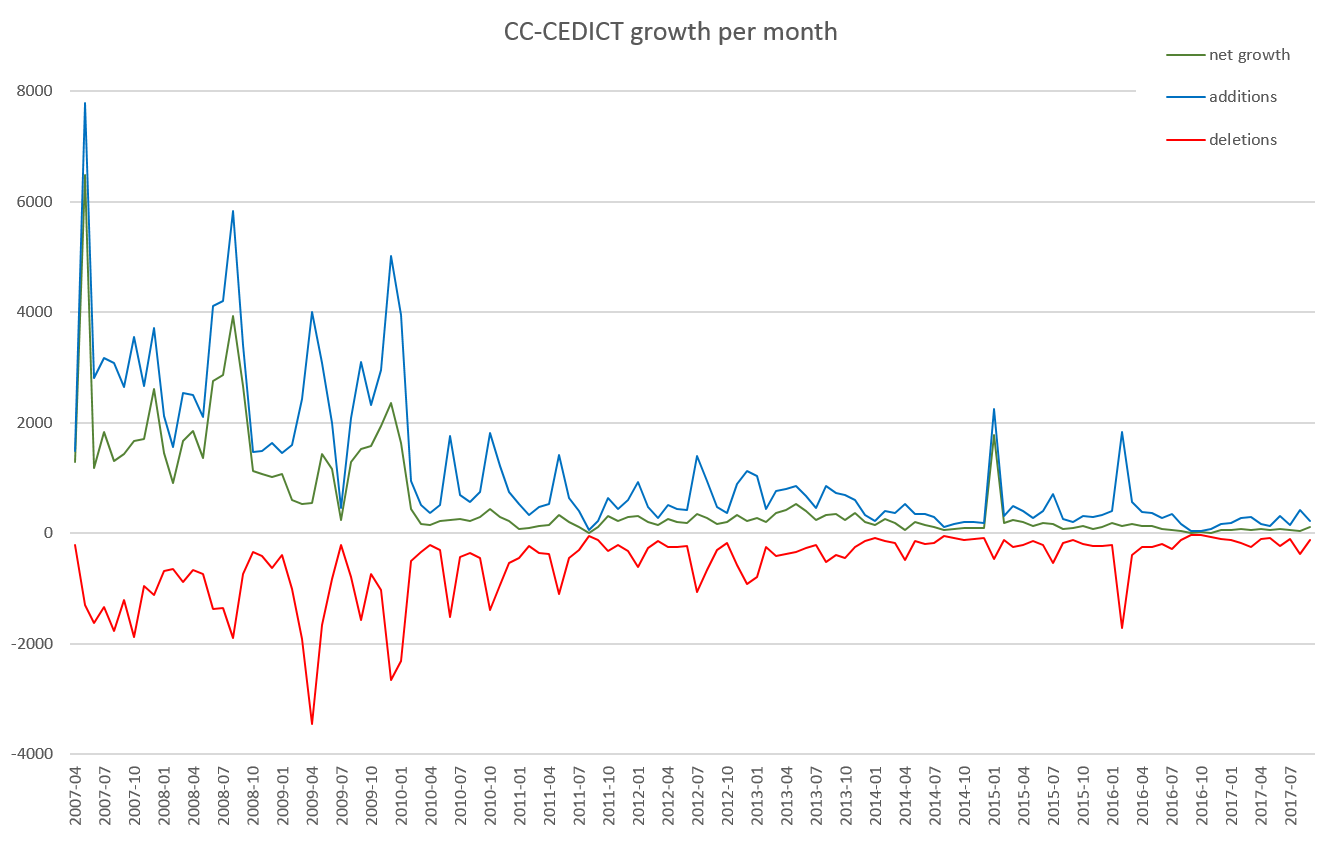
This chart excludes the first two months, in which the bulk of the existing content was imported via a few very large change sets. There appear to be two distinct phases: up to mid-2010, CC-CEDICT evolved intensively, both gaining new content and undergoing far-reaching edits (shown by simultaneously large volumes of additions and deletions). There are many change sets from this period that show an effort to standardize translations and remarks.
From mid-2010 onwards CC-CEDICT has settled into a calmer period of growth.
Editors and contributors
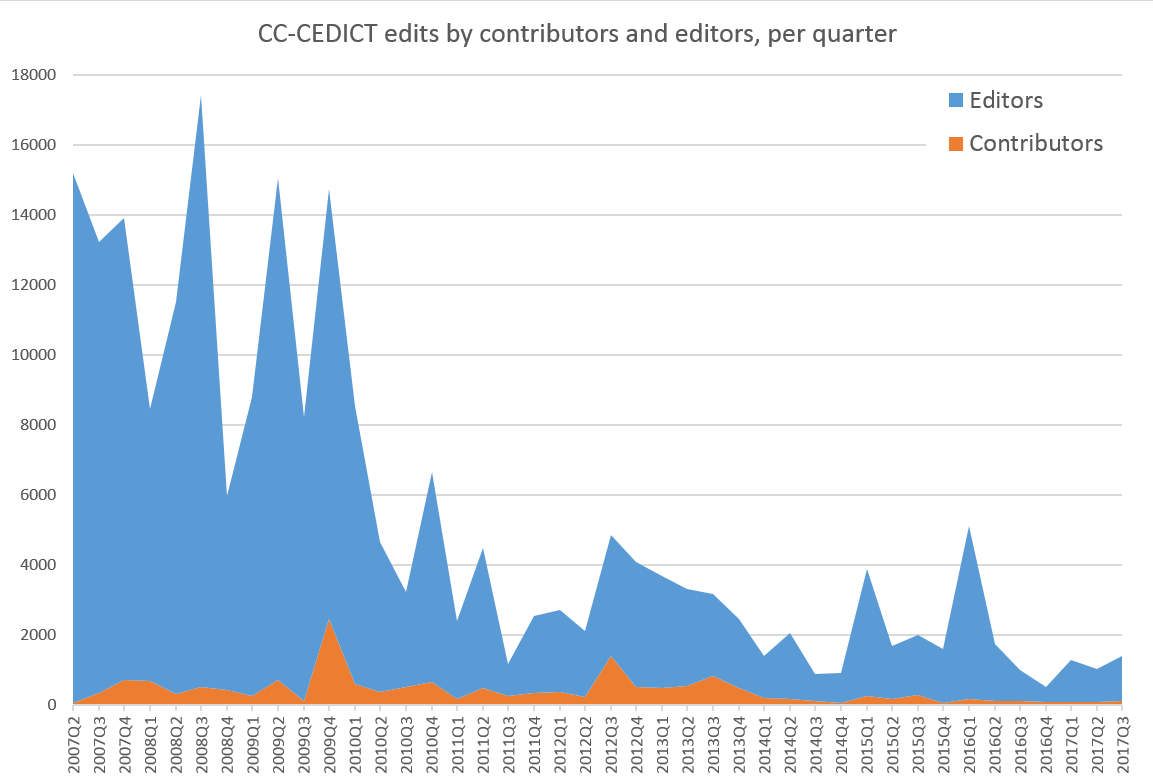
But who were the people contributing these changes, and who was contributing how much? I split the originators into editors and contributors through a heuristic. A person becomes an editor when their name first shows up in a change’s processed by field. Each change originates from the name in the submitted by field, and I used the heuristic to decide if the originator herself is an editor or a “mere” contributor.
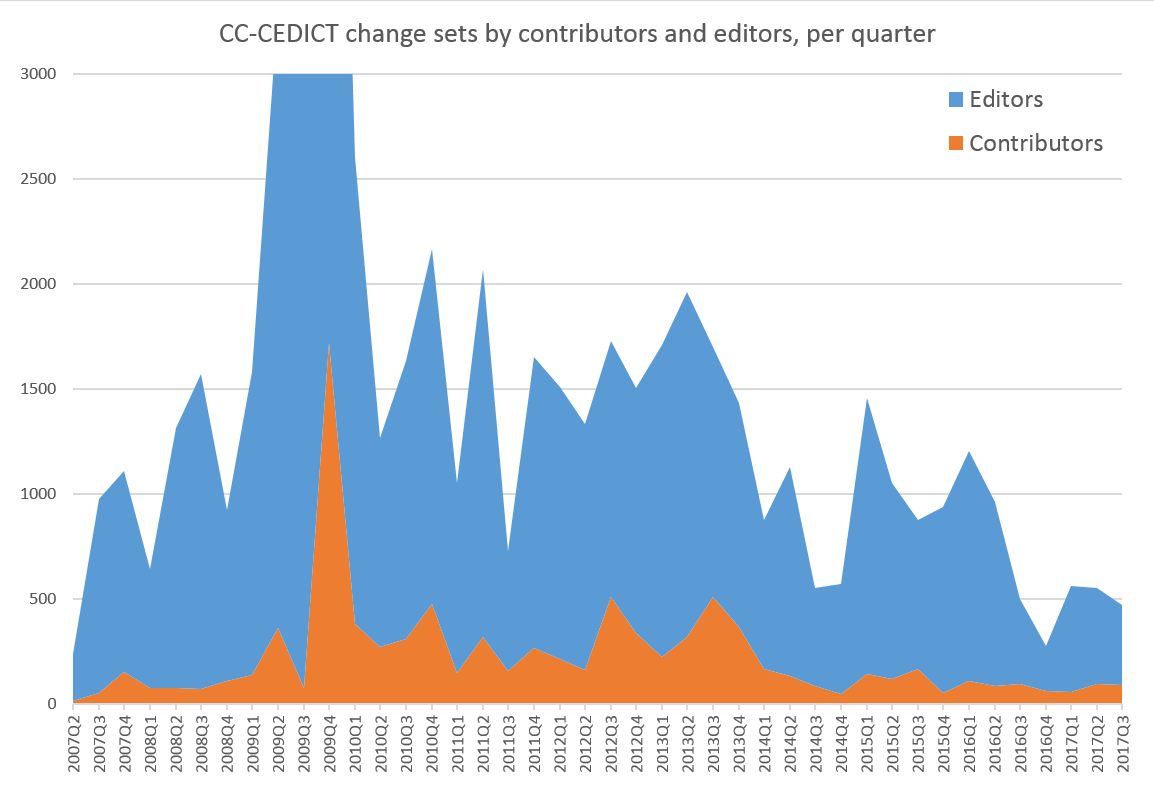
The chart below shows the number of edits coming from editors and contributors. This time I broke the timeline down into quarters instead of months. Every addition and deletion counts as a separate edit, which means that changing an existing entry shows up as 2 edits, while adding a new entry only shows up as 1 edit.
Now let’s look at the size of the populations submitting these edits. The chart below shows the number of editors and contributors submitting changes in a given quarter.
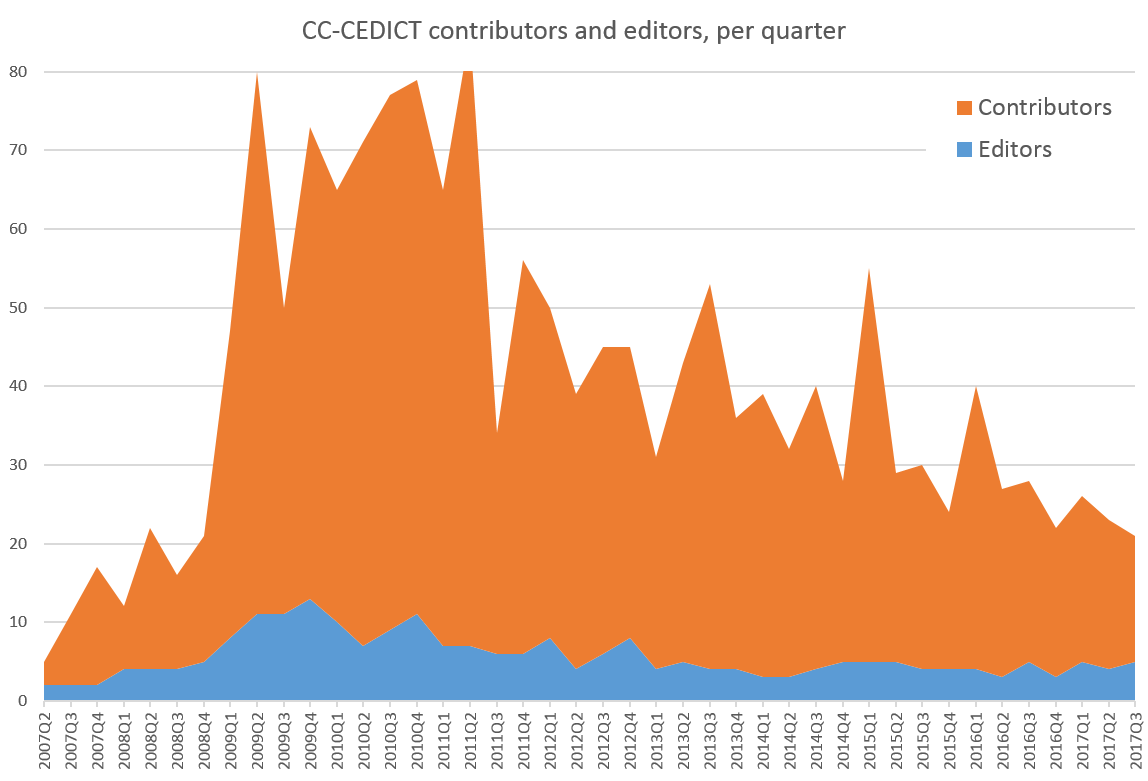
It’s clear that the proportions are inverted: all that blue sea of changes in the previous chart came from a small team of editors.
But maybe editors are busy correcting recurring errors and submitting other find-replace-style changes, while contributors are submitting smaller changes one word at a time, distorting our view. To compensate, the chart below shows the number of submitted change sets, and not the volume of edits.
While the blue and orange areas are still far apart, they diverge much less in this new chart. The ratio is also decreasing over time, meaning that submissions from the crowd are becoming proportionally more important.
Loyalty
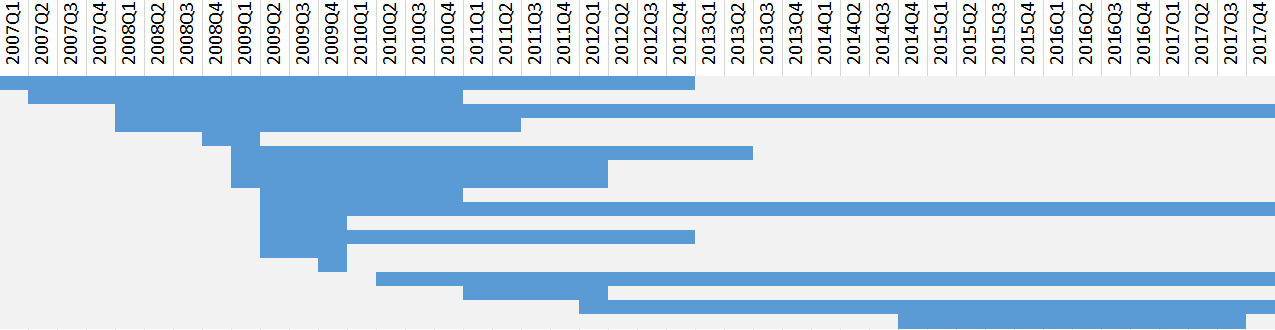
Once someone becomes an editor, how long do they continue contributing? I plotted the activity of CC-CEDICT’s editors in the chart below. Each horizontal swimlane corresponds to an editor, and the blue rectangles show the quarters when they were active. There are no breaks in any of these swimlanes: I considered an editor to be active the whole time between their first and last contribution.
How does this compare to the activity, over time, of contributors? The chart below repeats the analysis for them. The number of contributors is much larger, so the entire chart is vertically compressed. Also, with contributors, I allowed interrupted swimlanes when someone didn’t contribute in a given quarter, but contributed again later.
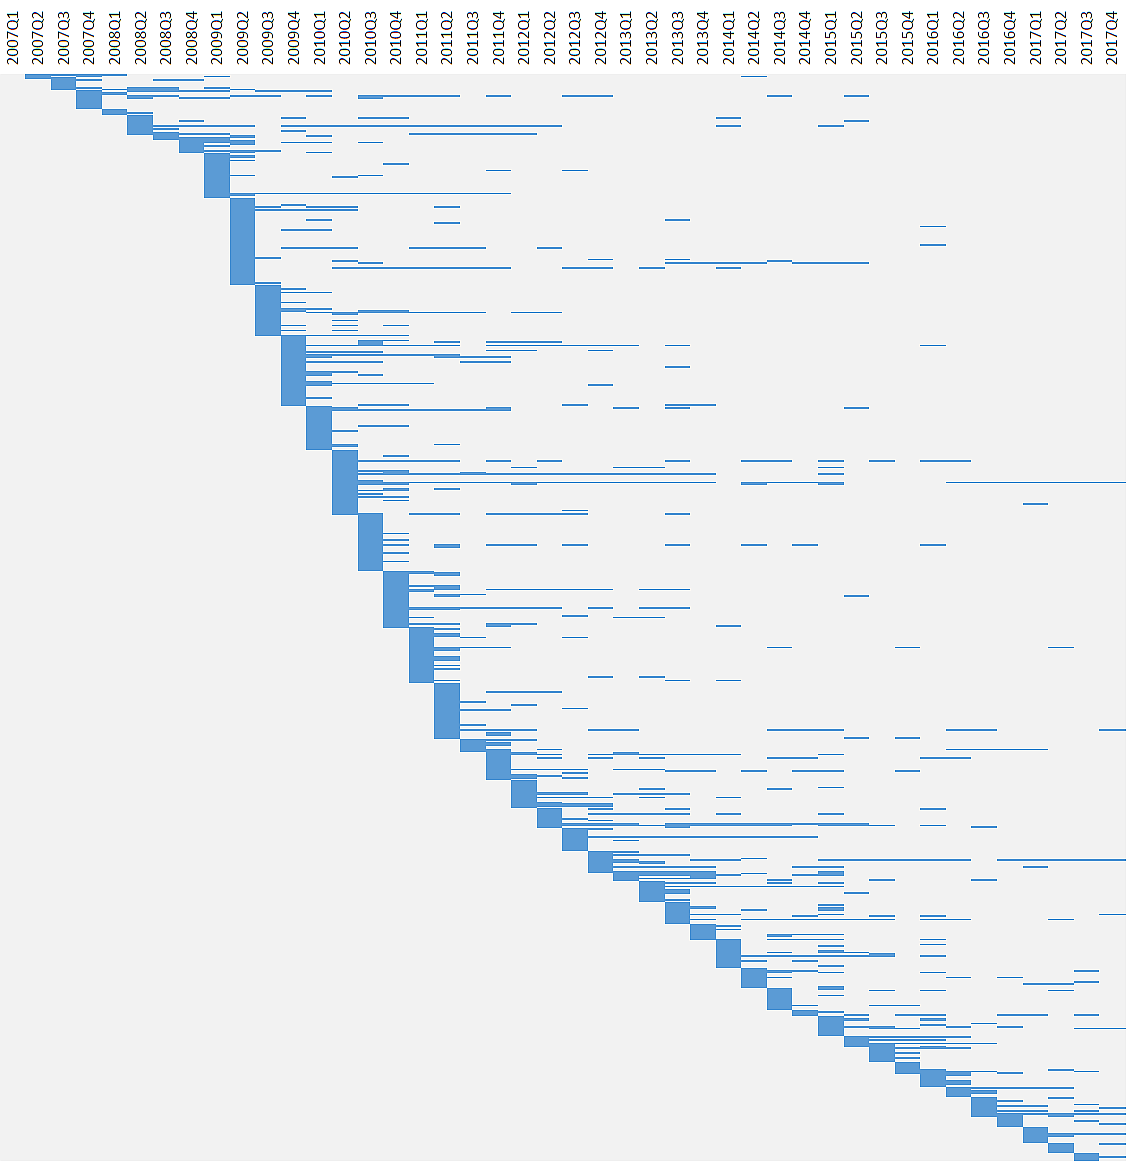
With a few exceptions, this larger population tends to contribute more on an ad-hoc basis, and in fact many people only contribute in a single quarter and then never return.
If you squint a little, the bottom of the “curve,” which represents the arrival of new contributors, seems to outline three distinct phases. Up to 2009Q1, CC-CEDICT was relatively slow to attract new contributors, but then the pace picked up. This active period lasted until 2011Q2. Since then the project has been adding contributors at a slower, roughly constant rate.
Volume vs rank
Let’s now ignore the time axis and take a look at the volume of each individual’s contributions. Every dot on the chart below is an editor or a contributor. The Y axis shows the number of additions and deletions; the X axis is the person’s rank in the list ordered by total contributions. Both axes use a log scale.
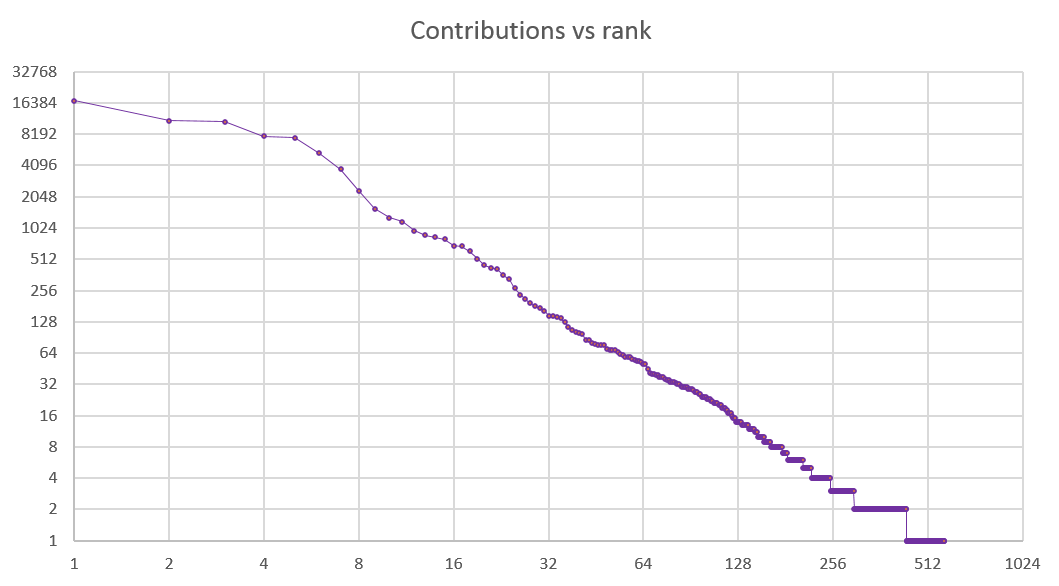
Editors show up on the left of the chart: they are few and far between, and they each contribute a lot. From about rank 6 the slope changes, and the larger number of contributors, each adding a smaller number of edits, begin to crowd up.
The top 6 people, or 1% of the entire population (all of them editors), contributed 59,854 edits. The entire population of 577 people contributed 85,231 edits. In other words, 1% of the population contributed 70% of changes. That proportion is very similar to the findings from Wikipedia.
The related chart below, including only contributors and excluding the editors, has a familiar shape.
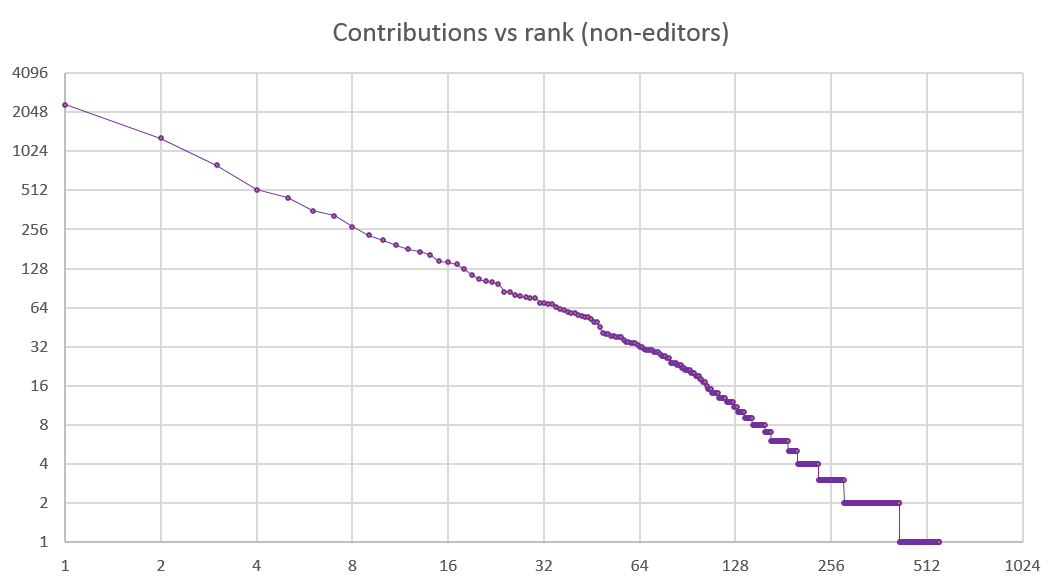
This is a textbook example of the Zipfian distribution.[9] What could be more adequate for a dictionary? In its original form Zipf’s law states that “given some corpus of natural language utterances, the frequency of any word is inversely proportional to its rank in the frequency table.” Clearly, the same is true for the contributors of this open-source repository of knowledge.
Chasing the long tail
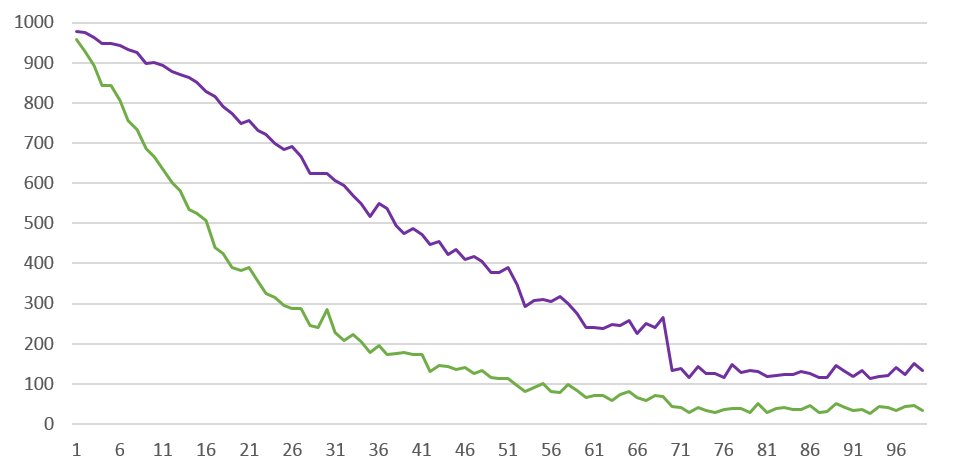
As a closing exercise, let’s look at the way CC-CEDICT’s lexical coverage evolved over time. I’m repeating a previous analysis[10] here, but with the added dimension of time. The chart below is a histogram: the X axis has 100 distinct points, each representing buckets of 1000 words from a ranked frequency list. The Y axis shows how many of each bucket’s words are present as a headword in CC-CEDICT. The green series is the headword list on April 1, 2007; the purple series is from October 1, 2017.
This chart needs a few extra words of explanation, and it comes with some caveats.
The word frequencies are from SUBTLEX-CH, based on a corpus of movie subtitles, published by Brysbaert et al.[11] in 2010. Two ingredients implicitly go into such a frequency list: the underlying corpus, and the segmentation method.
Many things speak for the psycho-linguistic adequacy of a corpus of movie subtitles. The word segmentation of Modern Standard Mandarin (MSM), however, is anything but straightforward. Brysbaert et al. used the ICTCLAS tokenizer[12], which I have been unable to execute. In a separate experiment I found that the output of another tokenizer, Jieba,[13] is significantly different, resulting in a different frequency list and thus also in a different histogram.
Sticking with the SUBTLEX-CH word frequencies, it’s important to keep data scarcity in mind. From about 70k onwards, all the words are hapaxes; words between about 54k and 70k have a frequency of 2. Basically, the entire right half of the chart is made up of two ranges where the specific rank is arbitrary.[14]
Finally, there is script (simplified vs. traditional). The frequency list is simplified, but CC-CEDICT has multiple headwords if either the traditional form or the Pinyin pronunciation is different. For my calculations I merged these entries and only considered CC-CEDICT’s distinct simplified headwords.
Of CC-CEDICT’s 38k headwords in 2007, less than 20k were present on this frequency list; the remaining ones are not attested as tokens in the ICTCLAS-segmented corpus at all. Of the 115k headwords in 2017, nearly 70k are beyond the SUBTLEX-CH frequency list. The chart below illustrates the progress between these two points. The blue series is the total headword count; the green series is the number of headwords not attested on the SUBTLEX-CH frequency list.
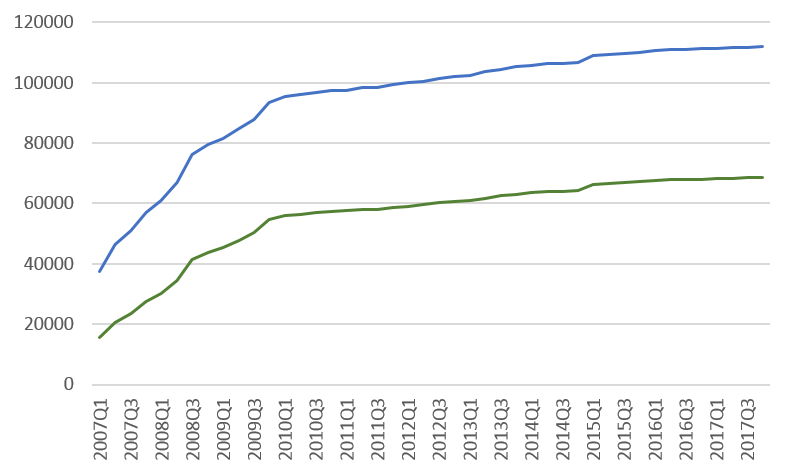
We can observe two distinct phases. Up to about 2010, during CC-CEDICT’s intensive growth period, the two series grow farther apart. The dictionary accrues both words from the top 100k tokens on the frequency list and words beyond the list’s limits. From 2010 onwards, the two curves are nearly parallel, which means the vocabulary accrued in this phase is mostly beyond the top-100k list.
This phase shift is, doubtless, partly an artefact of MSM tokenization. But it also signals that beyond about 90k headwords, the dictionary has covered the language’s core vocabulary, and the rest of the expansion comes from rare items in the long tail such as proper names, transcriptions, and the naturally slow accumulation of neologisms.
Closing thoughts
Criticism
I asked MBDG to comment on a draft of this post and he kindly replied with a few doubts of his own, and also relayed remarks from the CC-CEDICT editors.
He pointed out that when an existing entry is edited, that shows up as two changes (deletion+addition), while adding a new entry is a single change (addition). This might lead to funny conclusions, but unfortunately there’s no easy way around it. Entries do not have a unique ID, and edits often change headwords, which means these cannot be used as unique keys. Scholtes, Mavrodiev & Schweitzer[4] measured the extent of code changes through Levenshtein distance in their work. I could attempt something similar, combined with a heuristic to spot when a del+add pair is really an in-place edit. That might be interesting for a follow-up analysis.
Richard Warmington points out that what I termed a “calmer period of growth” misses a significant point: namely, that in recent years a lot more work goes into every edit, with editors scrupulously revising each other’s work and engaging in extensive research. That’s a completely valid point, and it is a reminder that quantitative methods by themselves never capture the full reality. My analysis also doesn’t do justice to the effort that goes into revising and improving existing, often quite “old” entries.
The rank-vs-coverage histogram must be taken with a pinch of salt, and Richard is less convinced about the suitability of a corpus of movie subtitles. That question is hard to settle because apparently there is no publicly available MSM word frequency list that derives from a balanced corpus. If you know of such a resource, I would be grateful for a pointer.
Acknowledgements
I am very grateful to all the CC-CEDICT editors and contributors for creating and continuously improving this resource. I have profited immensely from it, both in my own Chinese studies and in developing CHDICT.
I am especially thankful that the editors decided to release the change history under the same Creative Commons license that applies to the dictionary itself. This means I can publish the underlying data for this analysis, as well as the script I used to derive the charts.
Thanks to Adrian Colyer for his post, From Aristotle to Ringelmann,[15] pointing to the literature about the efficiency of software teams as size grows.
Data
[Download] The full change history since 2007, as a plain text file.[Gist] The script used to produce the visualized data.
[Download] The Excel file with the charts.
References
[1] Fred Brooks: The Mythical Man-Month: Essays on Software Engineering. Addison-Wesley, 1975. ISBN 0-201-00650-2.
[2] Mockus A, Fielding RT, Herbsleb J:
A case study of open source software development: The apache server.
In: Proceedings of the 22Nd international conference on software engineering.
ICSE ’00, ACM, New York, pp 263–272.
herbsleb.org/web-pubs/pdfs/mockus-acase-2000.pdf
[3] Sornette D, Maillart T, Ghezzi G: How much is the whole really more than the sum of its parts? 1 + 1 = 2.5: Superlinear productivity in collective group actions. (2014) PLoS ONE 9(8):e103,023.
[4] Scholtes et al.: From Aristotle to Ringelmann: A large-scale analysis of team
productivity and coordination in open-source software projects. ICSE 2016.
www.sg.ethz.ch/media/publication_files/paper_bQeEC8G.pdf
[5] Daniel Oberhaus: Nearly All of Wikipedia Is Written By Just 1 Percent of Its Editors.
Motherboard, Nov 7, 2017.
motherboard.vice.com/en_us/article/7x47bb/wikipedia-editors-elite-diversity-foundation
[6] CHDICT Chinese-Hungarian dictionary.
chdict.zydeo.net
[7] www.mdbg.net/chinese/dictionary
[8] cc-cedict.org/editor/editor.php?handler=ListChanges
[9] en.wikipedia.org/wiki/Zipf%27s_law
[10] A curious cliff: coincidence, anomaly, or proof of ancestry?
jealousmarkup.xyz/texts/a-curious-cliff
[11] Cai, Q., Brysbaert, M.: SUBTLEX-CH: Chinese Word and Character Frequencies Based on Film Subtitles. PLoS ONE 5(6): e10729. doi:10.1371/journal.pone.0010729 (2010) crr.ugent.be/programs-data/subtitle-frequencies/subtlex-ch
[12] Zhang Hua-Ping, Yu Hong-Kui, Xiong De-Yi Xiong and Liu Qun: HHMM-based Chinese Lexical Analyzer ICTCLAS. Proceedings of 2nd SigHan Workshop, July 2003, pp.184-187. github.com/NLPIR-team/NLPIR/tree/master/NLPIR%20SDK/NLPIR-ICTCLAS
[13] github.com/fxsjy/jieba by Sun Junyi (2013)
[14] D’Oh! It’s the hapaxes. And how lexicography is an uphill battle.
jealousmarkup.xyz/texts/d-oh-hapaxes-curious-coverage
[15] From Aristotle to Ringelmann. June 6, 2016.
blog.acolyer.org/2016/06/06/from-aristotle-to-ringelmann